Introduction
The KDJ indicator is a technical analysis tool that is widely used in futures and stock markets for short-term trend analysis. It is often referred to as a stochastic indicator and is considered an essential tool for traders who want to determine trends and entry points into trades. In this blog post, we will explore everything you need to know about the KDJ indicator, including its importance in trading, how it is calculated, interpretation, customization, strategies for using it, and common mistakes to avoid.
What is the KDJ Indicator?
The KDJ indicator is a derived form of the Slow Stochastic with the only difference being an extra line called the J line. The K and D lines are the same lines you will see when using the Stochastic Oscillator. The J-line represents the divergence of the %D value from the %K. The convergence of these lines will indicate emerging trading opportunities.
Importance of the KDJ Indicator in Trading
The KDJ indicator is an essential tool for traders who want to determine trends and entry points into trades. Unlike other indicators that only show overbought or oversold levels, the KDJ reflects the strength of price movements, overbought and oversold signals, and trading signals. This makes it a valuable tool for traders looking to make informed decisions based on market trends and price movements.
However, it is important to note that the KDJ may not work effectively in highly volatile markets. Traders should, therefore, use other indicators alongside the KDJ to achieve better results.
Understanding the KDJ Indicator
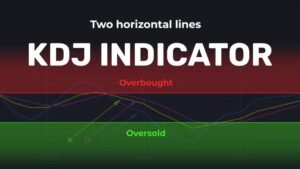
The KDJ indicator is calculated based on the highest price, the lowest price, and the closing price. It uses the realism of price fluctuations to reflect the strength of price fluctuations, overbought and oversold, and gives trading signals before prices rise or fall. The KDJ is plotted as three lines: the %K line, the %D line, and the J line.
The KDJ indicator consists of three lines – the %K line, %D line, and the %J line – each representing different aspects of price momentum:
- %K Line: This line is a measure of the current price relative to the high and low prices over a specific period. It is the primary line that indicates the fast-changing momentum.
- %D Line: The %D line is a moving average of the %K line, which smooths out the fluctuations and provides a more reliable signal for trading decisions.
- %J Line: The %J line is calculated by subtracting the %D line from the %K line, providing a more sensitive measure of momentum, and highlighting potential price reversals.
Calculation of the KDJ Indicator
The KDJ is used to obtain the random stochastic value (RSV) by calculating the proportional relationship between the highest, lowest, and closing prices that have occurred in a specific period and then smoothing the corresponding data to obtain a series of index values that are plotted to determine the movement of securities. The specific calculation is as follows:
First, calculate the RSV value of the period, then calculate the K value, D value, and J value. The KDJ can characterize short- and medium-term market fluctuations by setting different durations of time periods.
The KDJ indicator is calculated using the following steps:
- Determine the high and low prices over a specific period (e.g., 14 periods).
- Calculate the %K line using the following formula: %K = [(Current Close – Lowest Low) / (Highest High – Lowest Low)] x 100
- Calculate the %D line as a moving average of the %K line (e.g., a 3-period simple moving average).
- Calculate the %J line using the following formula: %J = 3 x %K – 2 x %D
Interpretation of the KDJ Indicator
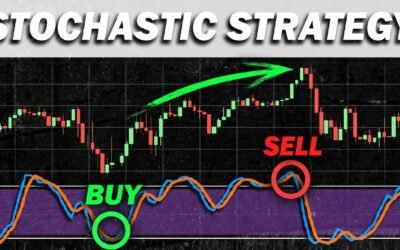
The KDJ is an oscillator that ranges from 0 to 100. The most commonly used levels for the KDJ indicator are 20 and 80. When the indicator is above 80, it is considered overbought, and when it is below 20, it is considered oversold.
Levels of the KDJ Indicator
● When the %K line crosses above the %D line, it is considered a bullish signal.
● When the %K line crosses below the %D line, it is considered a bearish signal.
● When the KDJ falls below 20 and intertwines, you should turn to the RSI indicator to see if there is a bullish signal. If both the KDJ and RSI indicators show upward signs, it suggests that the stock may go up.
● The J line is a directional sensitive line. When the J value is greater than 90, especially for more than five consecutive days, the stock price will at least form a short-term peak. On the contrary, when the J value is less than 10, especially for several consecutive days, the stock price will at least form a short-term bottom.
It is important to note that these interpretations are common but may not be suitable for all situations depending on the financial instrument being traded and they are for basic understanding only.
Customizing the KDJ Indicator
Traders can customize the KDJ indicator to suit their trading style and preferences. Below are some ways in which traders can optimize the KDJ indicator:
Optimal Settings for Different Timeframes
The optimal settings for the KDJ indicator depend on the timeframe of the chart. For instance, if you are using a daily chart, the optimal settings would be different from those of a 15-minute chart. Traders should, therefore, adjust the settings according to the timeframe of the chart they are analyzing.
Smoothing Price Action with KDJ Indicator
Traders can use the KDJ indicator to smooth out price action by using a longer period setting. This helps eliminate false signals and provides a clearer view of the market trend.
Strategies for Using KDJ Indicator
Below are some strategies that traders can use when using the KDJ indicator:
Identifying Overbought and Oversold Levels
The KDJ is an excellent tool for identifying overbought and oversold levels in the market. When the KDJ is above 80, it indicates that the market is overbought, and when it is below 20, it indicates that the market is oversold.
The KDJ indicator is particularly useful in identifying overbought and oversold levels, which can signal potential price reversals:
- Overbought: When the %K and %D lines rise above a predefined threshold (typically 80), it indicates that the asset is overbought, suggesting that the price may be due for a correction or reversal.
- Oversold: When the %K and %D lines fall below a predefined threshold (typically 20), it indicates that the asset is oversold, signaling that the price may be poised for a rebound or reversal.
Traders often pay close attention to the crossovers between the %K and %D lines:
- Bullish Signal: A bullish signal occurs when the %K line crosses above the %D line in the oversold region, suggesting a potential upward price movement.
- Bearish Signal: A bearish signal occurs when the %K line crosses below the %D line in the overbought region, indicating a potential downward price movement.
The %J line can provide additional confirmation of potential price reversals:
- Bullish Divergence: If the %J line forms a higher low while the price forms a lower low, it may signal a bullish divergence, indicating a potential price rebound.
- Bearish Divergence: If the %J line forms a lower high while the price forms a higher high, it may signal a bearish divergence, suggesting a potential price correction.
Divergences and Convergences
Traders can use divergences and convergences to identify potential trading opportunities. Divergence occurs when the price of an asset moves in the opposite direction of the KDJ indicator. Convergence, on the other hand, occurs when the price of an asset moves in the same direction as the KDJ indicator.
Combining KDJ Indicator with Other Technical Indicators – examples
Traders can combine the KDJ indicator with other technical indicators such as Moving Averages, Relative Strength Index (RSI), and Bollinger Bands to achieve better results. This helps to confirm signals and reduce the incidence of false signals.
Example 1: KDJ Indicator and Moving Averages
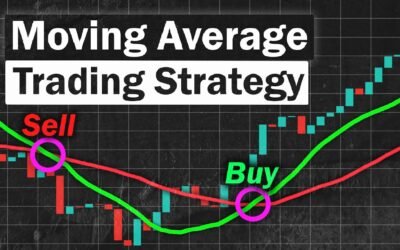
Moving averages are among the most widely used technical indicators, providing insights into trend direction and strength. By combining the KDJ indicator with moving averages, traders can better identify potential entry and exit points:
- Bullish Signal: When the %K line crosses above the %D line in the oversold region, and the price is above the moving average, it may indicate a potential buying opportunity.
- Bearish Signal: When the %K line crosses below the %D line in the overbought region, and the price is below the moving average, it may suggest a potential selling opportunity.
Example 2: KDJ Indicator and Bollinger Bands
Bollinger Bands are a volatility-based indicator that can help traders gauge market conditions and identify potential trend reversals. By combining the KDJ indicator with Bollinger Bands, traders can refine their trading signals:
- Bullish Signal: When the %K line crosses above the %D line in the oversold region, and the price touches or penetrates the lower Bollinger Band, it may signal a potential buying opportunity.
- Bearish Signal: When the %K line crosses below the %D line in the overbought region, and the price touches or penetrates the upper Bollinger Band, it may indicate a potential selling opportunity.
Example 3: KDJ Indicator and MACD
The Moving Average Convergence Divergence (MACD) is a momentum-based indicator that can help traders identify trend changes and confirm the strength of the trend. By combining the KDJ indicator with MACD, traders can enhance the reliability of their trading signals:
- Bullish Signal: When the %K line crosses above the %D line in the oversold region, and the MACD line crosses above the signal line, it may suggest a potential buying opportunity.
- Bearish Signal: When the %K line crosses below the %D line in the overbought region, and the MACD line crosses below the signal line, it may indicate a potential selling opportunity.
Example 4: KDJ Indicator and RSI
The Relative Strength Index (RSI) is another momentum-based indicator that can help traders identify overbought and oversold conditions. By combining the KDJ indicator with RSI, traders can improve the accuracy of their trading signals:
- Bullish Signal: When the %K line crosses above the %D line in the oversold region, and the RSI is below 30 (indicating oversold conditions), it may signal a potential buying opportunity.
- Bearish Signal: When the %K line crosses below the %D line in the overbought region, and the RSI is above 70 (indicating overbought conditions), it may suggest a potential selling opportunity.
Combining the KDJ indicator with other technical indicators can help traders refine their trading signals, reduce false alarms, and improve overall trading performance. By understanding the nuances of each indicator and adapting them to specific market conditions and trading styles, traders can enhance their decision-making process and increase their chances of success in the financial markets. However, it is essential to remember that no single indicator or combination of indicators can guarantee success, and traders must also consider factors such as risk management and portfolio diversification to ensure a well-rounded trading approach.
In addition to the examples provided in this article, traders are encouraged to experiment with other technical indicators and combinations to find the most effective strategies tailored to their individual trading preferences and objectives. Some other popular technical indicators that could be combined with the KDJ indicator include the Ichimoku Cloud, Parabolic SAR, and Fibonacci retracement levels.
By continuously honing their skills and refining their trading strategies, traders can navigate the ever-changing landscape of financial markets with greater confidence and success. Ultimately, the key to effective trading lies in understanding the strengths and limitations of various indicators, combining them judiciously, and adapting one’s approach to the market’s evolving dynamics.
Common Mistakes to Avoid
Below are some common mistakes that traders should avoid when using the KDJ indicator:
Overreliance on KDJ Indicator
Although the KDJ indicator is a valuable tool for traders, overreliance on it can be detrimental. Traders should not rely solely on the KDJ indicator but should also use other technical indicators and fundamental analysis to make informed decisions.
Ignoring Price Action
Traders should not ignore price action when using the KDJ indicator. Price action can provide valuable information on market trends and potential trading opportunities. Traders should, therefore, use price action in conjunction with the KDJ indicator to make informed decisions.
Not Adjusting Settings for Different Markets
Traders should adjust the settings of the KDJ indicator according to the market they are analyzing. Failure to do so can result in inaccurate signals and poor trading decisions.
Conclusion
The KDJ indicator is an essential tool for traders who want to determine trends and entry points into trades. However, traders should not rely solely on the KDJ indicator but should also use other technical indicators and fundamental analysis to make informed decisions. Traders should also avoid common mistakes such as overreliance on the KDJ indicator, ignoring price action, and failure to adjust the settings of the indicator according to the market being analyzed. By understanding how to use the KDJ indicator effectively, traders can achieve better results and make informed decisions.
Final Thoughts on KDJ Indicator
The KDJ indicator is a valuable tool for short-term trend analysis in the futures and stock markets. It reflects the strength of price movements, overbought and oversold signals, and trading signals. By understanding the calculations, interpretations, and customization options for the KDJ indicator, traders can make better decisions and take advantage of emerging trading opportunities. Additionally, by combining the KDJ indicator with other technical indicators and avoiding common mistakes, traders can enhance their overall trading strategies and achieve greater success in the markets.







 How to trade CFD? (00:49)
 How to trade binary options*? (01:22)
 Forex. How to start? (01:01)