Discover the secrets of using trend lines in day trading for both Forex and stocks. Our straightforward guide will teach you to draw trend lines accurately and utilize them to identify high probability trade setups. Enhance your trading strategy and boost your success rate with our expert tips and techniques. Start mastering the art of trend lines today for more informed and profitable trades!
Trend Lines Strategy for Day Trading Forex & Stocks (Simple Technique)
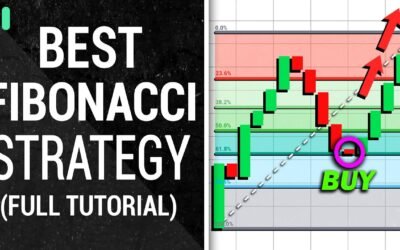
Trend lines are a powerful tool in the world of day trading, serving as key levels in trending markets to help traders identify high probability trade setups. In this article, we will delve deep into the art of drawing trend lines properly and explore how you can leverage them for successful trades in both Forex and stock markets.
Understanding Trend Lines
At their core, trend lines are key levels formed in trending markets. They act as visual representations of support and resistance levels, helping traders anticipate potential market movements. When the price approaches these levels, it presents opportunities for high win-rate trades. There are primarily two patterns associated with trend lines: the continuation pattern, where the price bounces back in the direction of the trend after hitting a trend line; and the breakout pattern, where the price breaks out of a trend line, potentially indicating a change in trend direction.
Drawing Trend Lines Effectively
One of the most common questions beginners have is whether trend lines should be drawn hitting the wicks, the candles’ close, or the candle’s body. The answer is simple: draw them where they touch the most points on the chart, providing a clear visual guide. Remember, trend lines are meant to be treated as general areas, not precise points.
In an uptrend, you would place your trend line below the trend, adjusting it to touch as many lows as possible. Conversely, in a downtrend, you would place the trend line above the trend, adjusting it to touch as many highs as possible.
Utilizing Trend Lines for High Probability Trade Setups
Continuation Patterns
When a continuation pattern forms, it’s crucial not to jump into a trade immediately upon the price hitting a trend line. Additional price action techniques, such as drawing a mini trend line at the pullback and waiting for the price to break out of this mini trend line, can provide confirmation. Indicators like Stochastics can also serve as a valuable tool for confirmation, with trades taken once the indicator moves back inside overbought or oversold levels.
Breakout Patterns
Breakout patterns signal a potential change in trend direction. To avoid false breakouts, look for signs of momentum loss before the breakout and use additional confirmation techniques. Double rejections before a breakout can also serve as a strong indicator of a potential trend change.
Implementing RSI in Trend Line Strategy
The Relative Strength Index (RSI) can be a valuable tool in confirming trend line breakouts. By adjusting the RSI settings to have a single line at the 50 level, you can create a rule to only take buy positions when the RSI is above 50 and sell positions when it is below 50. This adds an extra layer of confirmation, ensuring that you are trading in the direction of the overall momentum.
Conclusion
Trend lines are a versatile and valuable tool in day trading, helping to highlight potential trade setups in trending markets. By learning how to draw them effectively and utilizing additional confirmation techniques, traders can increase their chances of executing successful trades. Whether you are trading Forex or stocks, incorporating trend lines into your trading strategy can provide clear visual cues and improve your trading precision. So, grab your charts, start drawing those trend lines, and prepare for a more informed and strategic trading experience.
References:
- Investopedia – Trend Lines: A comprehensive guide on what trend lines are and how to use them in trading.
- BabyPips – How to Draw Trend Lines Properly: A detailed tutorial on drawing trend lines accurately in Forex trading.
- TradingView – Trend Line Trading Strategies: Various trading strategies and ideas related to trend line usage in different markets.


 How to trade CFD? (00:49)
 How to trade binary options*? (01:22)
 Forex. How to start? (01:01)